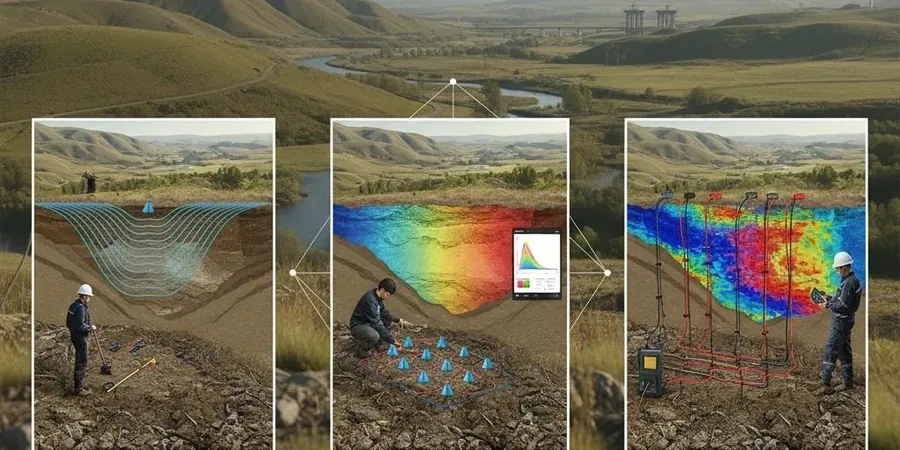
Newcastle’s rebirth from its industrial roots into a modern coastal city has placed new demands on its underground. The central business district sits on a complex mix of Permian coal measures and weathered rhyodacite, while the expanding suburbs push into hillsides where the Newcastle Coal Measures are near the surface. We run seismic tomography surveys here that cut through the guesswork. Mapping bedrock depth and rippability across a site on Merewether Heights requires a different approach than profiling for a CBD excavation near Hunter Street. The seismic velocity models we produce give engineers the ground truth they need before a single bucket hits the dirt. Where coal seams or abandoned mine workings are suspected, combining seismic tomography with resistivity imaging often reveals the full picture of subsurface voids and fractured zones.
A seismic velocity tomogram turns a blind excavation into a planned operation—contractors in Newcastle know the difference shows up in the earthmoving bill.
Scope of work
A recent project on a sloping site in The Junction involved a 12-storey mixed-use building with two basement levels. The developer needed to know where the rhyodacite bedrock began because the basement excavation would remove 7 metres of overburden. We ran three refraction lines across the footprint. The tomograms showed the rock surface dipping from 4 metres at the street frontage to 11 metres at the rear, with a wedge of completely weathered material sitting in a paleochannel that the desk study had not predicted. The structural engineer used those velocity boundaries to adjust the bored pile lengths zone by zone, saving the client roughly 140 linear metres of drilling into hard rock. This is the kind of information that boreholes alone, spaced at 15-metre centres, can easily miss. On sites where coal seams are present, we also run downhole seismic to check for low-velocity layers that correlate with the Fassifern or Great Northern Seams, which are notorious for collapsing during piling in the Merewether–Adamstown corridor.
FAQ
What does a seismic tomography survey typically cost for a Newcastle site?
For a single-family lot or a small commercial site, budget between AU$4,600 and AU$8,680. The range depends on line length, number of shots, and whether we are doing refraction only or a combined refraction-MASW survey. A larger subdivision or infrastructure job with multiple lines and deeper reflection targets will be priced by the lineal metre. Every quote we issue includes the full interpretation report with velocity tomograms in PDF and digital format.
Can seismic methods detect old mine workings beneath a Newcastle property?
Yes, under the right conditions. Voided workings appear as zones of anomalously low P-wave velocity or as disruptions in the reflection continuity. The method works best when the workings are within 20–30 metres of the surface and the overburden is not overly saturated. We cross-reference any seismic anomalies with the Subsidence Advisory NSW mine archive, and if the risk is confirmed we recommend targeted drilling to verify the feature before construction proceeds.
How long does a seismic survey take and will it disrupt the site?
A standard two-line refraction survey on a residential block takes one day with a two-person crew. The only noise is the hammer or weight-drop impact, which lasts a fraction of a second and is repeated a few dozen times per line. No drilling, no heavy vehicles, and the geophones are removed the same day. Grassed areas recover within a week. For larger sites with multiple spreads, we schedule the work to keep the survey window as short as possible.
Do you provide the AS 1170.4 site class from seismic data?
Absolutely. We run MASW or downhole seismic to measure the shear-wave velocity profile over the top 30 metres, then compute the Vs30 value. That number translates directly into a site class—B, C, D, or E—under AS 1170.4, which the structural engineer uses to determine the seismic design coefficient for the building. The report includes the processed dispersion curves, the 1D Vs profile, and the site class recommendation with all supporting data.